Low-carbon technology investment strategies with blockchain under subsidy policies
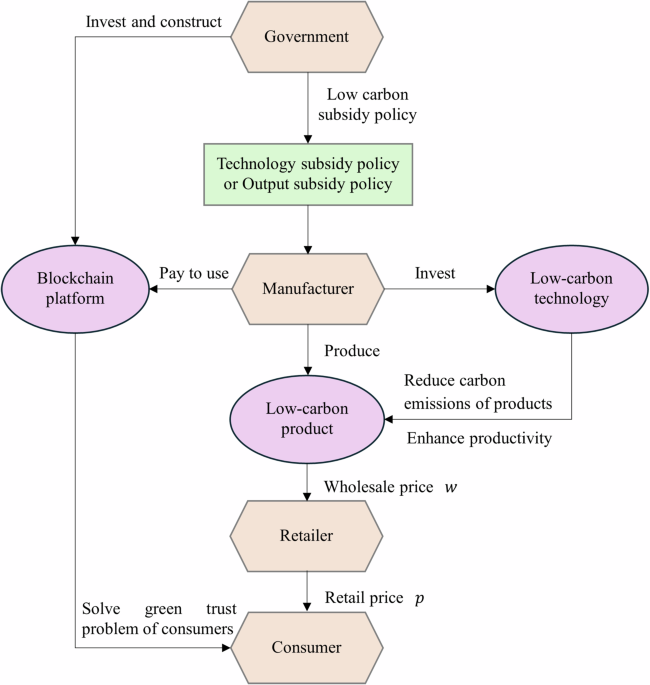
A unique equilibrium solution exists for the government’s implementation of either the TSP or OSP, depending on whether the manufacturer applies BT. Based on the equilibrium results, we conduct the following analysis: (1) the effects of the CER cost coefficient, LC preference coefficient, and green trust degree on the equilibrium results; (2) a comparative analysis of two SPs in the scenarios where the manufacturer applies or does not apply BT, and a comparative analysis of two SPs when the manufacturer applies BT.
We denote \(M=\left\{A,B\right\}\), and \(N=\left\{A,B,C,D\right\}\). The specific conclusions are summarised below with the proofs provided in the Appendix.
Sensitivity analysis
This section examines the impact of the LCT investment cost coefficient k, LCP coefficient β, and green trust factor λ on the key equilibrium variables, including the CER rate, demand, wholesale price, retail price, and profits of both manufacturers and retailers.
Proposition 1. As the LCT investment cost coefficient k increases, the following expressions are observed: \(\frac{\partial {r}^{N* }}{\partial k} < 0\), \(\frac{\partial {q}^{N* }}{\partial k} < 0\), \(\frac{\partial {p}^{N* }}{\partial k} < 0\), \(\frac{\partial {w}^{N* }}{\partial k} < 0\), \(\frac{\partial {\pi }_{m}^{N* }}{\partial k} < 0\), and \(\frac{\partial {\pi }_{r}^{N* }}{\partial k} < 0\).
Proposition 1 suggests that irrespective of whether the manufacturer applies BT, increases in the LCT investment cost coefficient k lead to lower CER rates, demand, wholesale price, retail price, and profits for the manufacturer and retailer under both SPs. An increase in this coefficient implies lower LCT investment efficiency, resulting in a weaker CER effect. When retailers observe a decline in the level of product emissions reductions, they are incentivised to lower retail prices to maintain demand. This reduced demand influences the SC and the consumer end, prompting manufacturers to lower wholesale prices due to concerns regarding unsold inventories. This reduced demand is the primary factor driving lower retailer profits, whereas lower demand, lower wholesale prices, and higher LCT investment costs contribute to lower manufacturer profits.
These findings suggest that reducing the cost coefficient of LCT investments or improving its efficiency is conducive to improving the LC level of products. In practice, technology accounts for 30% of the overall determinants of the enterprise’s emission reduction effect (Song et al., 2023). Thus, enterprises should be incentivised to research, develop, and improve LCT to increase efficiency and hence benefit from emission reduction. Technological advances and scale effects reduce the cost of emission reduction and increase investment in renewable energy. For example, as reported by the International Renewable Energy Agency (IRENA), due to the overall advancement of renewable energy technology, by the end of 2022, global renewable energy capacity reached 3,372 GW, representing an increase of 9.6% year-on-year, with solar power capacity increasing by 22% (191 GW) (EP, 2023).
Proposition 2. As the LC preference coefficient β increases, the following expressions are observed: \(\frac{\partial {r}^{N* }}{\partial \beta } > 0\), \(\frac{\partial {q}^{N* }}{\partial \beta } > 0\), \(\frac{\partial {p}^{N* }}{\partial \beta } > 0\), \(\frac{\partial {w}^{N* }}{\partial \beta } > 0\), \(\frac{\partial {\pi }_{m}^{N* }}{\partial \beta } > 0\), \(\frac{\partial {\pi }_{r}^{N* }}{\partial \beta } > 0\).
Proposition 2 suggests that the increasing consumer preference for LC products leads to higher CER rates, demand, wholesale prices, retail prices, and profits for manufacturers and retailers under both SPs, regardless of whether the manufacturer applies BT. An increase in the LC preference coefficient β enhances consumer sensitivity to LC products, incentivising more investment in LCT as higher market demand creates a more favourable return on investment. In turn, the increased demand stimulates enterprises’ willingness to invest in LCT, leading to the cyclical nature of LCSC. In addition, a higher consumer preference for LC products enables firms to increase product prices, as SC firms often pass on some of their LCT investment costs to consumers.
These findings demonstrate that maintaining a high preference for LC products can lead to increased investments in LCT and higher profits. Simultaneously, firms increase the pricing of preferred LC products, reflecting the commercial value of carbon reduction. In addition to advertising and other publicity measures, the government can implement a reward mechanism that cultivates consumers’ LC behaviour awareness. For example, a collaborative platform developed by Tencent and the Shenzhen Municipal Bureau of Ecological Environment, along with other institutions, has created a system that qualifies and rewards positive carbon behaviour by constructing a set of citizens’ CER mechanisms (CNR News, 2022). This mechanism, with characteristics of “recordable, measurable, profitable, and recognised”, establishes a positive feedback loop that combines commercial incentives and policy encouragement. Such incentives can help nurture a growing base of consumers with strong LC preferences, which, in turn, will contribute to the expansion of the LC product market.
Proposition 3. As the green trust factor λ increases, the following effects are observed: \(\frac{\partial {r}^{M* }}{\partial \lambda } > 0\), \(\frac{\partial {q}^{M* }}{\partial \lambda } > 0\), \(\frac{\partial {p}^{M* }}{\partial \lambda } > 0\), \(\frac{\partial {w}^{M* }}{\partial \lambda } > 0\), \(\frac{\partial {\pi }_{m}^{M* }}{\partial \lambda } > 0\), and \(\frac{\partial {\pi }_{r}^{M* }}{\partial \lambda } > 0\).
Proposition 3 reveals that an increase in the green trust λ leads to higher carbon reduction rates, demand, wholesale price, retail price, and profits for manufacturers and retailers, especially when BT is not applied, under both SPs. An increase in green trust indicates that consumers have greater confidence in the manufacturers’ LC claims, whether through blockchain disclosure or marketing efforts. This trust incentivises firms with low emission reduction levels to invest in LCT more aggressively, knowing that consumers will respond positively. The main factors influencing demand in this context are green trust levels and emission reductions. As green trust increases, more consumers with LC preferences tend to break down information barriers and buy the manufacturer’s products, driving up demand. This, in turn, prompts manufacturers to increase wholesale prices and retailers to adjust their retail prices accordingly. Ultimately, the profits of all SC members will increase.
These results suggest that fostering green trust can significantly enhance the manufacturer’s incentive to reduce emissions and invest in LCT when BT has not been applied. In the absence of BT, governments can foster consumer trust in LCT and green products through certification systems and public awareness campaigns. For instance, the “Energy Star” programme, jointly launched by the U.S. The Department of Energy (DOE) and the Environmental Protection Agency (EPA) enhance consumer confidence in energy-efficient products via their labelling system. By incentivising firms to redesign products and adopt advanced technologies to meet energy efficiency standards, the programme awards the Blue Energy Star label to the top 25% of the most energy-efficient products (GBA, 2017). This boost in green trust not only drives LCT investments but also increases firm profitability through enhanced market competitiveness. Additionally, a high level of green trust allows manufacturers to better transfer the cost of investment in LCT to consumers, thereby facilitating the development of the LC market.
Comparative analysis
In this section, propositions 4 to 7 compare the equilibrium solutions of the two SPs when BT is not applied, while propositions 8 to 11 perform the same comparison when BT is applied.
Proposition 4. When comparing the equilibrium CER rate under the TSP and OSP when the BT is not applied, the following can be observed: when \(0 < \mu < {\bar{\mu }}_{1}\), \({r}^{A* } > {r}^{B* }\); when \(\mu > {\bar{\mu }}_{1}\), \({r}^{B* } > {r}^{A* }\) (as shown in Fig. 2).
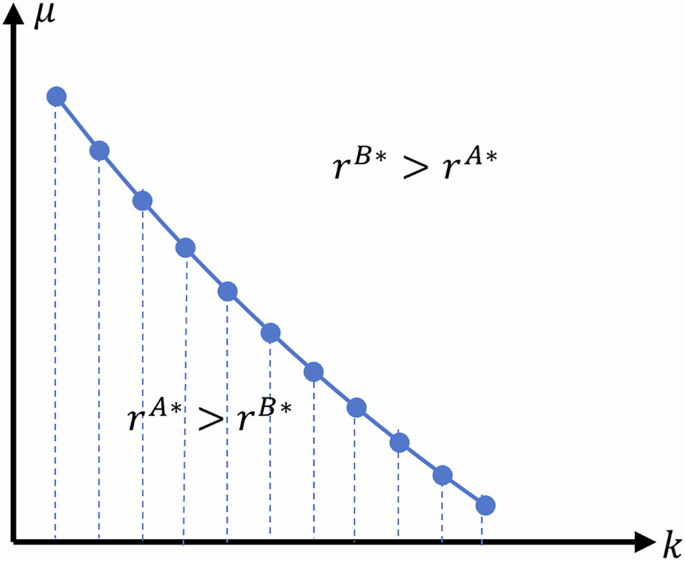
Relationship between the size of CER rate r for models A and B.
The results show that TSP is more effective for increasing the CER rate of enterprises when the unit subsidy for manufacturers is small (\(0 < \mu < {\bar{\mu }}_{1}\)). Under such conditions, OSP yields a lower total subsidy for the manufacturers, resulting in weaker incentives to invest in LCT. In contrast, when the unit subsidy amount μ is large (\(\mu > {\bar{\mu }}_{1}\)), the OSP promotes a higher CER rate. In this case, the OSP offers a larger total subsidy to manufacturers, thereby enhancing their incentives to invest in LCT.
These findings suggest that the effectiveness of TSP versus OSP in driving firms’ investment in LCT depends on the size of the unit subsidy. When the amount of subsidy per unit is low (high), manufacturers are more likely to choose to invest in a TSP (OSP).
Proposition 5. When comparing the equilibrium wholesale and retail prices under the TSP and OSP when BT is not applied, the following conclusions can be drawn: \({w}^{A* } > {w}^{B* }\), and \({p}^{A* } > {p}^{B* }\).
Proposition 5 shows that wholesale and retail prices are higher under TSP. This is because the level of total TSP is directly linked to the CER rate of manufacturers, whereas OSP is related to the total output of LC products from enterprises investing in LCT. In other words, the total amount under OSP is demand-driven; the higher the demand for LC products, the higher the production, which in turn increases the subsidy received. Therefore, manufacturers under the OSP have an incentive to lower wholesale prices, such that they can foster greater demand to increase the total subsidy. Furthermore, manufacturers under the TSP already receive subsidies when investing in LCT, which gives them an incentive to pass on costs to consumers. Consequently, manufacturers tend to set higher wholesale prices under the TSP.
These findings suggest that TSPs lead to higher wholesale and retail prices in the absence of BT. This phenomenon can be attributed to the fact that high-intensity TSP incentivises manufacturers to prioritise investments in high-value-added technologies. Such technologies often require higher product pricing to ensure cost recovery and profitability. Conversely, OSPs primarily aim to expand market scale, which intensifies price competition and constrains firms’ ability to set premium prices for their products. For example, the German government provided substantial R&D subsidies to BMW, focusing on high-value-added areas such as battery management systems, intelligent driving assistance, and vehicle connectivity (CAAM, 2024). These efforts enabled BMW to launch the i8 plug-in hybrid with a starting price significantly higher than that of comparable models, reflecting its advanced technology and premium market positioning. Excessively high product prices could discourage consumers from purchasing such products. Therefore, when BT is not applied, the government can implement an OSP to control product prices and ensure that they remain within a reasonable range.
Proposition 6. By comparing the equilibrium demand under the TSP and OSP when BT is not applied, we draw the following conclusions: when \(0 < \mu < {\bar{\mu }}_{2}\), \({q}^{A* } > {q}^{B* }\); when \(\mu > {\bar{\mu }}_{2}\), \({q}^{B* } > {q}^{A* }\) (as shown in Fig. 3).
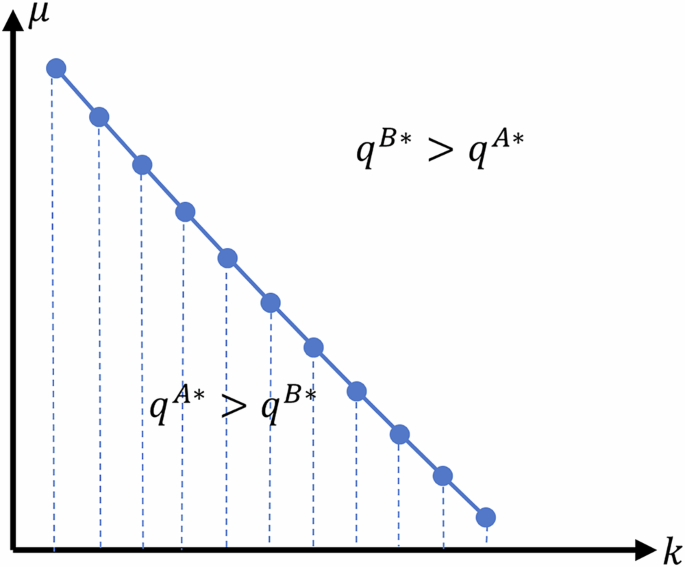
Relationship between the size of demand q for models A and B.
Proposition 6 demonstrates that when the unit subsidy amount μ is small (\(0 < \mu < {\bar{\mu }}_{2}\)), the TSP is more effective in increasing demand than the OSP. When the unit subsidy amount μ is large (\(\mu > {\bar{\mu }}_{2}\)), the OSP is more advantageous in terms of stimulating demand. This is because, in the absence of BT, the primary factor influencing demand is the CER rate. As noted in Proposition 4, when the unit subsidy amount is small, the TSP incentivises enterprises to invest more in LCT, leading to a higher CER rate and, consequently, higher demand. In contrast, when the unit subsidy amount is larger, the main factor affecting demand is still the carbon reduction rate. However, OSP provides greater incentives for enterprises to invest in LCT, which results in higher demand.
These findings suggest that the size of the unit subsidy not only affects manufacturers’ willingness to invest in LCT under different policies, but also the quantity demanded through the CER rate. When the investment cost coefficient for LCT is high, resulting in lower investment efficiency, the level of green trust becomes a more significant factor affecting the quantity demanded than the CER rate. In such cases, enterprises can improve the green trust level of consumers through information disclosure or marketing strategies, thereby increasing demand.
Proposition 7. By comparing the equilibrium manufacturer’s and retailer’s profit under the TSP and OSP when BT is not applied, the following conclusions can be drawn: when \(0 < \mu < {\bar{\mu }}_{3}\), \({\pi }_{m}^{A* } > {\pi }_{m}^{B* }\); when \(\mu > {\bar{\mu }}_{3}\), \({\pi }_{m}^{B* } > {\pi }_{m}^{A* }\) (as shown in Fig. 4). Further, when \(0 < \mu < {\bar{\mu }}_{4}\), \({\pi }_{r}^{A* } > {\pi }_{r}^{B* }\); when \(\mu > {\bar{\mu }}_{4}\), \({\pi }_{r}^{B* } > {\pi }_{r}^{A* }\) (as shown in Fig. 5).
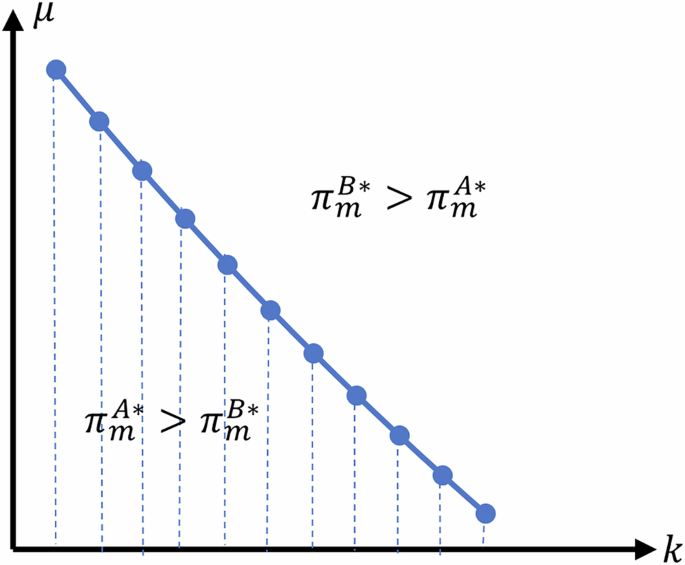
Manufacturer profit πm Relationship for models A and B.
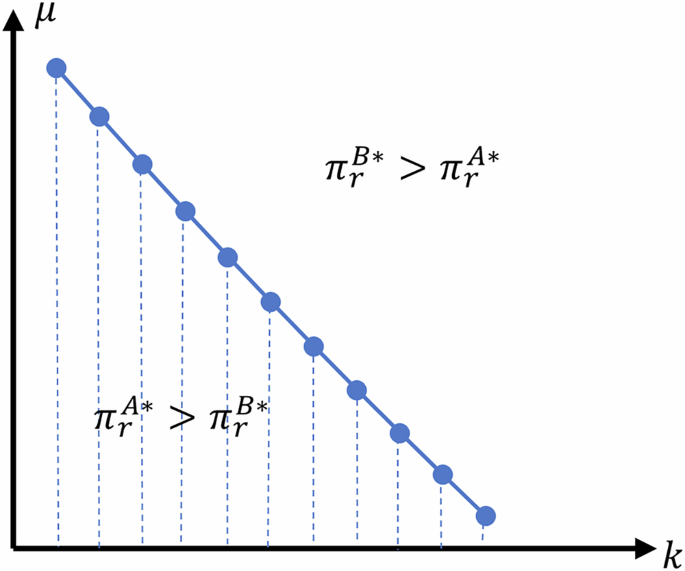
Retailer profit πr Relationship for models A and B.
Proposition 7 demonstrates that when the unit subsidy amount μ is small (\(0 < \mu < {\bar{\mu }}_{3}\) or \(0 < \mu < {\bar{\mu }}_{4}\)), both manufacturers and retailers gain higher profits under the TSP. However, when the unit subsidy amount μ is large (\(\mu > {\bar{\mu }}_{3}\) or \(\mu > {\bar{\mu }}_{4}\)), the OSP is more favourable for manufacturers and retailers. According to Proposition 6, when the unit subsidy is small (large), the demand under the TSP (OSP) is higher, which in turn, helps increase the profits of SC firms.
These findings indicate that manufacturers’ and retailers’ profits are directly related to unit subsidy size. Specifically, when the unit subsidy is small (large), SC firms are more likely to choose to invest and produce under the TSP (OSP).
Proposition 8. By comparing the equilibrium CER rate under the TSP and OSP when the BT is applied, we draw the following conclusions: when \(0 < \mu < {\bar{\mu }}_{5}\), \({r}^{C* } > {r}^{D* }\); when \(\mu > {\bar{\mu }}_{5}\), \({r}^{D* } > {r}^{C* }\) (as shown in Fig. 6).
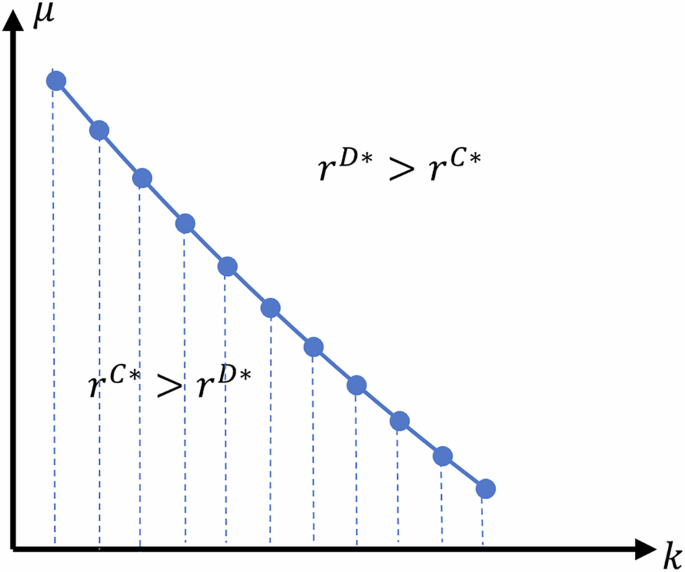
Relationship between the size of CER rate r for models C and D.
The results show that the TSP is more effective at increasing the CER rate of enterprises under a small government subsidy for manufacturers to produce a single LC product μ (\(0 < \mu < {\bar{\mu }}_{5}\)). In contrast, when the unit subsidy amount μ is large (\(\mu > {\bar{\mu }}_{5}\)), the OSP facilitates higher CER rates. This result mirrors the situation when BT is not applied: when the subsidy per unit is small, the TSP provides more incentives to invest in LCT, leading to a higher rate of CER. However, when the subsidy amount is larger, the OSP offers a greater incentive for manufacturers to improve their willingness to invest in LCT under the OSP, resulting in higher CER rates.
Proposition 9. By comparing the equilibrium wholesale price and the retail price under TSP and OSP when BT is applied, the following conclusions can be drawn: when \(0 < \mu < {\bar{\mu }}_{6}\), \({w}^{C* } > {w}^{D* }\); when \(\mu > {\bar{\mu }}_{6}\), \({w}^{D* } > {w}^{C* }\) (as in Fig. 7); Further, when \(0 < \mu < {\bar{\mu }}_{7}\), \({p}^{C* } > {p}^{D* }\); when \(\mu > {\bar{\mu }}_{7}\), \({p}^{D* } > {p}^{C* }\) (as in Fig. 8).
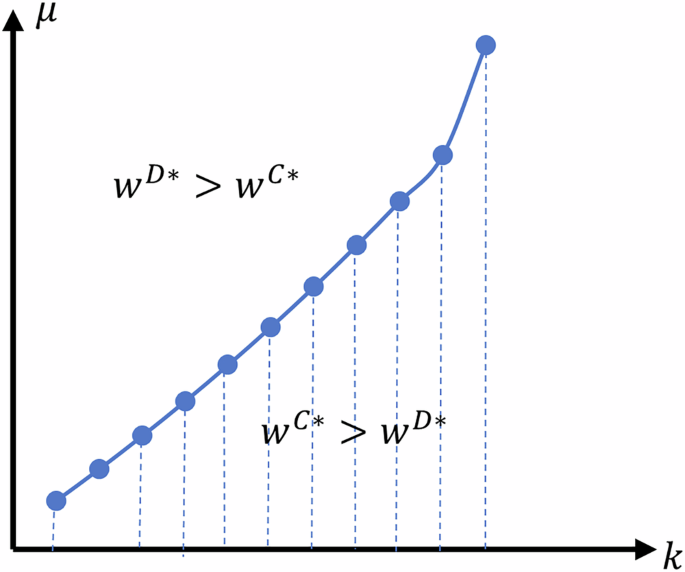
Manufacturer profit w Relationship for models C and D.
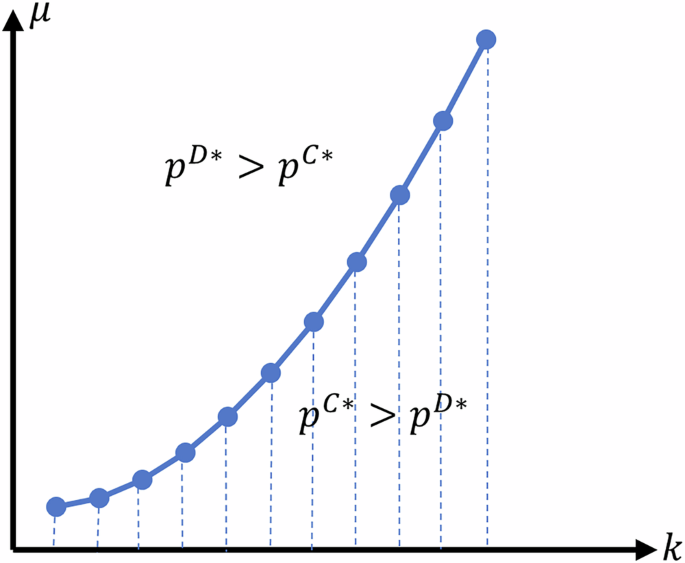
Retailer profit p Relationship for models C and D.
Proposition 9 demonstrates that when the unit subsidy μ is small (\(0 < \mu < {\bar{\mu }}_{6}\) or \(0 < \mu < {\bar{\mu }}_{7}\)), both wholesale and retail prices are higher under the TSP. In contrast, when the unit subsidy μ is large (\(\mu > {\bar{\mu }}_{6}\) or \(\mu > {\bar{\mu }}_{7}\)), both wholesale and retail prices are higher under the OSP. As discussed in Proposition 5, when BT is not applied, the wholesale and retail prices under the TSP are higher than those under the OSP. However, when BT is applied, the level of consumer green trust in the enterprise is maximised. Consumers can directly observe an increase in the CER rate. Consequently, the cost of LCT investment increases, prompting enterprises to pass the cost on to consumers by setting higher wholesale prices.
This analysis demonstrates that BT influences enterprise pricing strategies under different SPs. Specifically, without blockchain implementation, firms operating under TSP tend to adopt higher product pricing. Conversely, with BT adoption, firms receiving smaller total subsidies are more likely to reduce prices, reflecting a lower willingness to invest in LCT. Such firms seek to enhance profitability by leveraging price reductions, underscoring the interplay between subsidy intensity and LC investment incentives.
Proposition 10. By comparing the equilibrium demand under the TSP and OSP when BT is applied, the following conclusions can be drawn: when \(0 < \mu < {\bar{\mu }}_{8}\), \({q}^{C* } > {q}^{D* }\); when \(\mu > {\bar{\mu }}_{8}\), \({q}^{D* } > {q}^{C* }\) (as shown in Fig. 9).
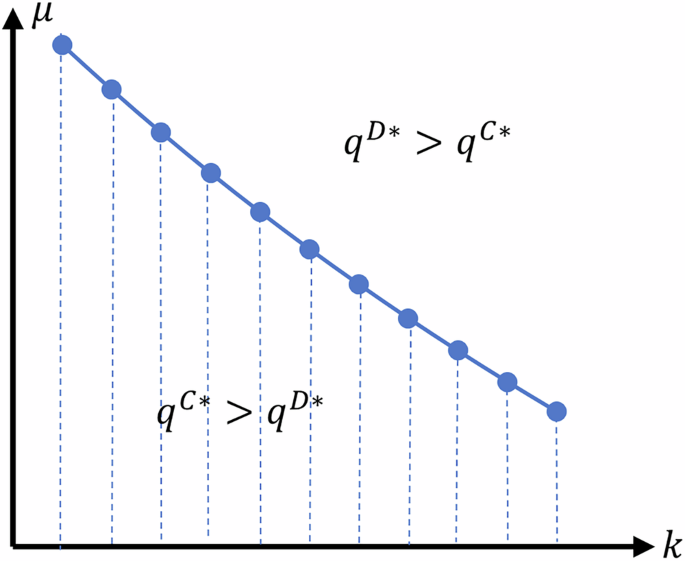
Relationship between the size of demand q for models C and D.
Proposition 10 shows that when the unit subsidy amount μ is small (\(0 < \mu < {\bar{\mu }}_{8}\)), the TSP is more effective in increasing demand than the OSP. However, when the unit subsidy amount μ is large (\(\mu > {\bar{\mu }}_{8}\)), the OSP is superior for increasing demand. This result can be attributed to the fact that when enterprises apply BT, product information becomes fully transparent, and the primary factor affecting demand is the CER rate. As previously stated in Proposition 7, when the amount of unit subsidy is small (large), the CER rate under the TSP (OSP) is higher, leading to increased demand.
These findings suggest that the level of consumer green trust in enterprises is maximised when enterprises apply BT compared to when they do not. In addition, the CER rate is the primary factor influencing demand. Therefore, the government must control the application cost for BT, thereby encouraging more enterprises to adopt the technology by implementing appropriate SPs tailored to market conditions to incentivise enterprises to invest more in LCT; this can, in turn, boost demand.
Proposition 11. A comparison of the equilibrium manufacturer’s and retailer’s profits under the TSP and OSP when BT is applied leads to the following conclusion: when \(0 < \mu < {\bar{\mu }}_{9}\), \({\pi }_{m}^{C* } > {\pi }_{m}^{D* }\); when \(\mu > {\bar{\mu }}_{9}\), \({\pi }_{m}^{D* } > {\pi }_{m}^{C* }\) (as shown in Fig. 10); Further, when \(0 < \mu < {\bar{\mu }}_{10}\), \({\pi }_{r}^{C* } > {\pi }_{r}^{D* }\); when \(\mu > {\bar{\mu }}_{10}\), \({\pi }_{r}^{D* } > {\pi }_{r}^{C* }\) (as shown in Fig. 11).
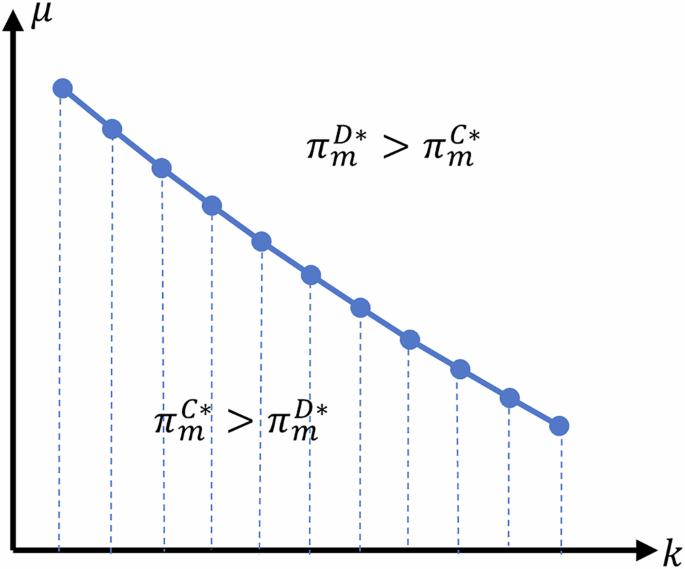
Manufacturer profit πm Relationships for models C and D.
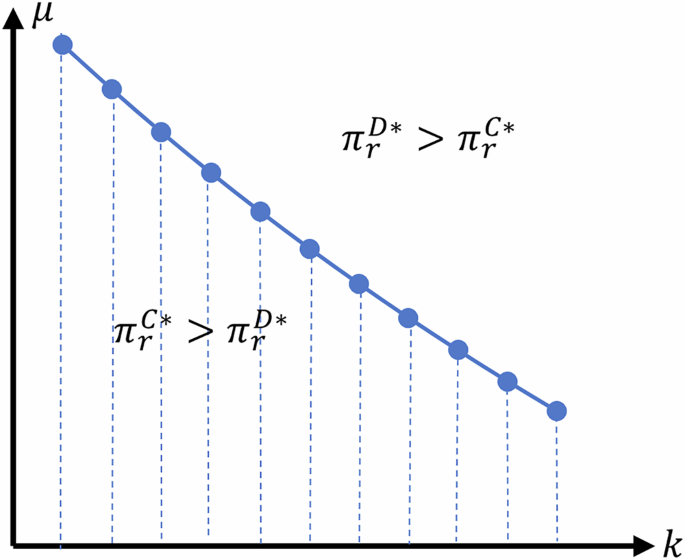
Retailer profit πr Relationships for models C and D.
Proposition 11 indicates that when the unit subsidy amount μ is small (\(0 < \mu < {\bar{\mu }}_{9}\) or \(0 < \mu < {\bar{\mu }}_{10}\)), the TSP enables SC firms to earn higher profits. Furthermore, when the unit subsidy amount μ is large (\(\mu > {\bar{\mu }}_{9}\) or \(\mu > {\bar{\mu }}_{10}\)), the OSP is more optimal for SC firms. According to Proposition 10, when the amount of subsidy per unit is small, the demand under the TSP is higher. Moreover, because investment in LCT is greater under the TSP, the benefits of improved production efficiency and reduced production costs are more pronounced. This leads to higher profits for SC firms. Similarly, when the unit subsidies are large, the OSP leads to higher demand and, due to increased investments in LCT, greater improvements in production efficiency and cost reductions. These factors ultimately lead to higher profits.
These findings suggest that, for SC enterprises that adopt BT, investing in LCT increases product demand, reduces production costs, and enhances production efficiency, thereby driving higher profits.
Corollary 1. The influencing factors of the policy threshold \({\bar{\mu }}_{t}\) (where \({t}=\,1,\,2,…,\,10\)) are analysed as follows:
-
(1)
\(\frac{\partial {\bar{\mu }}_{t}}{\partial z} < 0\);
-
(2)
when \(c < \bar{c}\), \(\frac{\partial {\bar{\mu }}_{6}}{\partial k} < 0\); when \(c > \bar{c}\), \(\frac{\partial {\bar{\mu }}_{6}}{\partial k} > 0\). When \(c < \widetilde{c}\), \(\frac{\partial {\bar{\mu }}_{7}}{\partial k} < 0\); when \(c > \widetilde{c}\), \(\frac{\partial {\bar{\mu }}_{7}}{\partial k} > \!\!0\);
-
(3)
\(\frac{\partial {\bar{\mu }}_{x}}{\partial k} < 0\) (where \({x}=\,1,\,2,\,3,\,4,\,5,\,8,\,9,\,10\)).
Corollary 1 (1) shows that the threshold \({\bar{\mu }}_{t}\) is negatively correlated with the initial unit production cost z. As factors such as equipment ageing reduce production efficiency, the threshold declines, thereby enhancing the effectiveness of OSP in promoting LCT adoption, consumer demand and SC performance. In contrast, for firms applying BT and making substantial LC R&D investments, improved efficiency raises \({\bar{\mu }}_{t}\), making OSP effective only under high per-unit subsidy levels—thus favouring TSP.
Corollary 1 (2) reveals that the influence of the investment cost coefficient k on thresholds \({\bar{\mu }}_{6}\) and \({\bar{\mu }}_{7}\) depends on blockchain unit cost. When blockchain cost is low (\(c < \bar{c}\) or \(c < \widetilde{c}\)), the thresholds decrease with increasing k. When the cost is high (\(c > \bar{c}\) or \(c > \widetilde{c}\)), the thresholds increase with k.
Corollary 1 (3) indicates that thresholds \({\bar{\mu }}_{x}\) are negatively related to k. This suggests that lower investment efficiency (or higher costs) reduces the threshold, making OSP a more suitable option. In high-tech firms or regions, further improvements require greater investment, lowering thresholds and enhancing the effectiveness of OSP. Conversely, higher thresholds favour TSP in low-tech settings with lower marginal investment costs.
Figure 12 further illustrates the threshold’s role in determining the effectiveness of policy. Without blockchain, a crossover point exists between TSP (Model A) and OSP (Model B). Before this point, TSP yields better outcomes. However, as k increases and \({\bar{\mu }}_{1}\) falls, OSP becomes increasingly effective at the same subsidy rate. These results suggest that policy thresholds can be adjusted through the investment cost coefficient or production cost. From an environmental standpoint, increases in either parameter lower the threshold, narrowing the scope for TSP and enhancing the relative advantage of OSP.
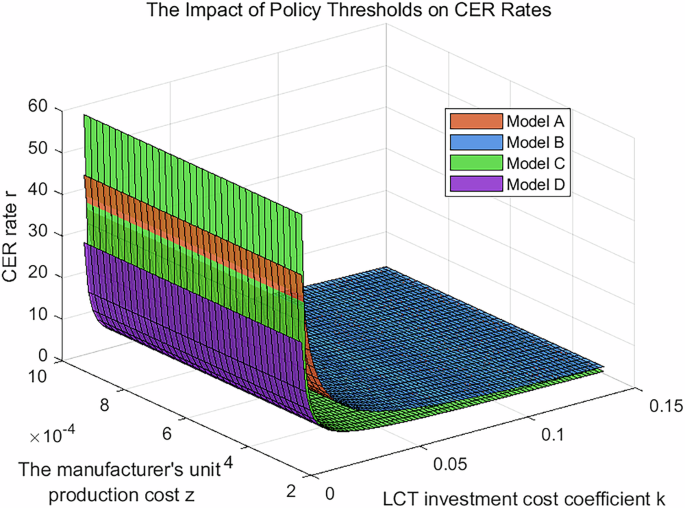
Impact of the policy threshold on the CER rate.
Key findings
The sensitivity and comparative analyses yielded several key findings.
TSP and green trust: a delicate balance between pricing and profitability
Under TSP, manufacturers’ optimal CER rate and profitability show a positive correlation with the level of green trust. In the absence of BT, product prices are higher than those under OSP. However, the adoption of BT incentivises manufacturers to increase wholesale prices, a decision directly influenced by the subsidy amount. These findings suggest that TSP trigger distinct different incentive mechanisms for manufacturers’ behaviour depending on the technological context.
Total subsidies as drivers of LC investment willingness
The study reveals that an increase in the total subsidy amount, whether provided through TSP or OSP, significantly enhances manufacturers’ willingness to invest in LCT. This finding underscores that subsidy amounts have a broad impact, influencing not only manufacturers’ specific emission reduction strategies but also acting as a vital catalyst for the overall LC transition of the SC. Therefore, the careful design of subsidy schemes is essential to ensure optimal policy outcomes.
Dual driving effect of BT and green trust
BT ensures complete transparency of LC information, thereby maximising consumer green trust. Under these circumstances, manufacturers are significantly motivated to intensify their emissions reduction efforts. Although the resulting increase in both green trust and CER rates leads to higher retail prices, the market demand for LC products continues to grow, reflecting a preference for environmentally responsible offerings. Conversely, in the absence of BT, the incomplete transparency of LC information limits green trust levels. Consequently, without active promotion and marketing of the products by governments or corporations, manufacturers must depend on further increases in CER rates and adjustments to pricing strategies to adapt to evolving consumer preferences.
Dynamic relationships between transparency and consumer demand
The study reveals that in the absence of BT, an increase in green trust effectively motivates manufacturers to intensify their emission reduction efforts. These efforts not only lead to higher wholesale and retail prices but also stimulate demand growth by strengthening consumer preferences for LC products. This finding reveals that even when information transparency is incomplete, the synergistic relationship between green trust and consumer preferences can still promote the expansion of the LC product market.
Strategic trade-offs of dual SPs
Both TSP and OSP have distinct advantages and disadvantages in terms of incentivising LC transformation. Their impacts vary significantly depending on the implementation of BT. This highlights the importance for policymakers to consider the relationship between subsidy intensity, technological transparency, and market demand when designing policies and exploring multidimensional synergies to better promote the research and application of LCT.
link


